| Stand | Thinning | QMD, pre-harvest (D; in) | QMD, removed trees (d; in) | d/D ratio |
|---|---|---|---|---|
| Stand #1 | Thin from above | 6.27 | 16.10 | 2.57 |
| Stand #1 | Thin from below | 6.27 | 4.66 | 0.74 |
| Stand #1 | Thin throughout | 6.27 | 6.27 | 1.00 |
| Stand #2 | Thin from above | 7.28 | 11.68 | 1.60 |
| Stand #2 | Thin from below | 7.28 | 6.09 | 0.84 |
| Stand #2 | Thin throughout | 7.28 | 7.28 | 1.00 |
| Stand #3 | Thin from above | 12.21 | 24.11 | 1.97 |
| Stand #3 | Thin from below | 12.21 | 9.13 | 0.75 |
| Stand #3 | Thin throughout | 12.21 | 12.21 | 1.00 |
Thinning is a common silvicultural technique to harvest trees in a forest stand that leaves more growing space and resources for residual trees. For example, a thinning prescription might be to remove 40% of the basal area in a stand. However, there are several ways in which trees can be removed during a thinning.
The choice of which trees to thin depends on the management objectives and the distribution of the diameters in a stand:
- Thin from below: Trees are removed from the bottom of the stand’s diameter distribution, i.e., small diameter trees are removed.
- Thin from throughout: Trees are removed from throughout the diameter distribution, i.e., trees of all sizes are removed.
- Thin from above: Trees are removed from the top of the stand’s diameter distribution, i.e., large diameter trees are removed.
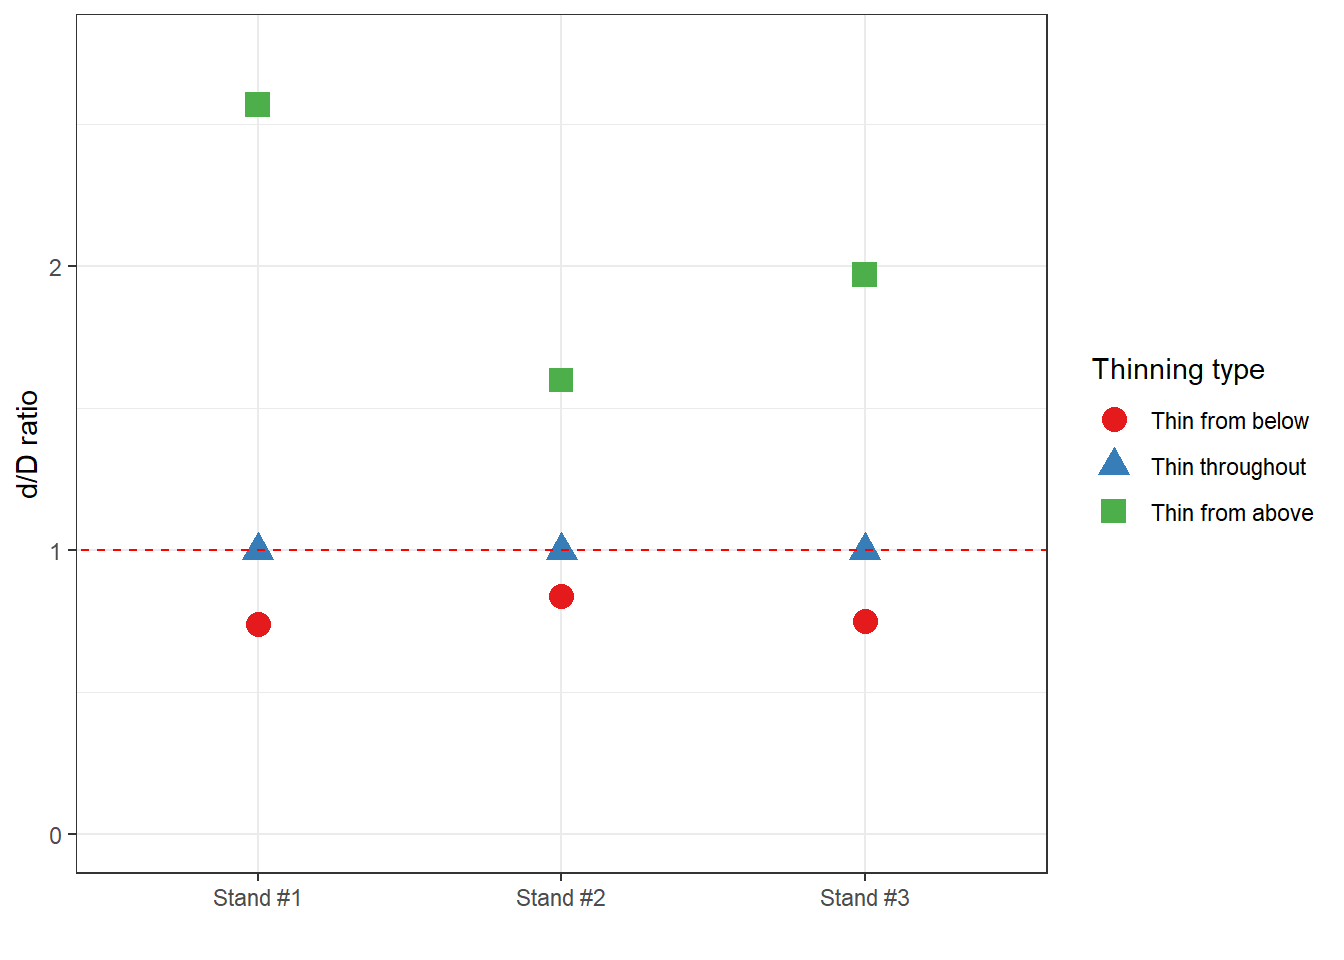
There is one important metric that can help identify the type of thinning. Understanding the average size of the trees removed and the size of trees prior to the harvest can help in determining which type of thinning occurred. Smith et al. 1997 1 discuss the d/D ratio, where d is the quadratic mean diameter (QMD) of removed trees and D is the QMD of the plot immediately prior to harvest. By taking the ratio of these two values, this indicates that:
- If d/D < 1.0, data indicate removal from below,
- if d/D > 1.0, data indicate removal from above, and
- if d/D = 1, data indicate a removal from throughout the diameter range.
This post describes how to quantify the d/D ratio using a case study of three stands in western Maine.
Thinning from below, above, or throughout
Three stands from western Maine were gathered from the Forest Inventory and Analysis database (also described here):
- Stand #1 had an initial basal area in 2025 of 140 sq. ft/ac. Eastern hemlock and northern red oak were the dominant species.
- Stand #2 had an initial basal area in 2025 of 188 sq. ft/ac. Red spruce and to a lesser extent paper birch were the dominant species.
- Stand #3 had an initial basal area in 2025 of 140 sq. ft/ac. Yellow birch and sugar maple were the dominant species.
The Northeast variant of the Forest Vegetation Simulator (FVS) was used to simulate the forest composition in these stands for 50 years. Each stand was thinned to a residual basal area of 80 sq. ft/ac in 2035. In addition, the method of thinning was set to a thin from below, thin throughout, and thin from above in three different scenarios.
Using the data from pre-harvest and removed trees, here is the info from each stand:
Note that the thinnings from above have a ratio greater than 1, thinnings from below have a ratio greater than 1, and thinnings from throughout the diameter range have a value equal to one:
These d/D ratios can help to identify the type of thinning that has occurred in a stand. They can also provide an objective approach for identifying the type of thinning that has occurred. A limitation of the d/D value is the need of having both pre- and post-harvest forest inventory data, in particular for quantifying the mean diameter of trees removed in a harvest. However, these data are likely available if trees were commercially harvested.
As this post shows, quantifying the d/D metric can provide an objective approach to understanding the thinning type that has occurred. This can aid in modeling what the future forest will look like and the potential it has for carbon storage.
–
Want to read more?: Our recent article Characterizing timber harvest occurrence and intensity to inform forest carbon management across the eastern United States analyzes timber harvest characteristics. Using the d/D ratio, common thinning treatments (e.g., from below, above, or throughout) are labeled for each forest type group for a broad assessment of thinning strategies common in eastern US forests.
By Matt Russell. Email Matt with any questions or comments.
Footnotes
Smith, D.M., Larson, B.C., Kelty, M.J., and Ashton, P.M.S. (1997). The practice of silviculture: applied forest ecology. John Wiley and Sons, New York. 560 pp.↩︎